MLS data updated Jul 17, 2026
Thornton Park / Milk District
Walkable Urban Living Around Lake Eola
Orlando, FL
A pair of adjacent urban neighborhoods — Thornton Park's Victorian cottages overlook Lake Eola while the Milk District anchors Orlando's independent arts and dining scene.
Median sold: $520K · Median days on market: 28 · Sold-to-list: 97.1% · Source: Stellar MLS
About 3.1 months of inventory — homes are selling faster than new ones come on the market, so sellers hold the leverage (under 4 months = seller's market).
Aggregate statistics from recent Stellar MLS closed sales and live MLS inventory. A market read, not an appraisal of any home or a listing of individual sales.
Want this as a printable report?
Generate a clean, branded multi-page PDF of the Thornton Park / Milk District market — perfect to print or email.
Ryan's Take on Thornton Park / Milk District
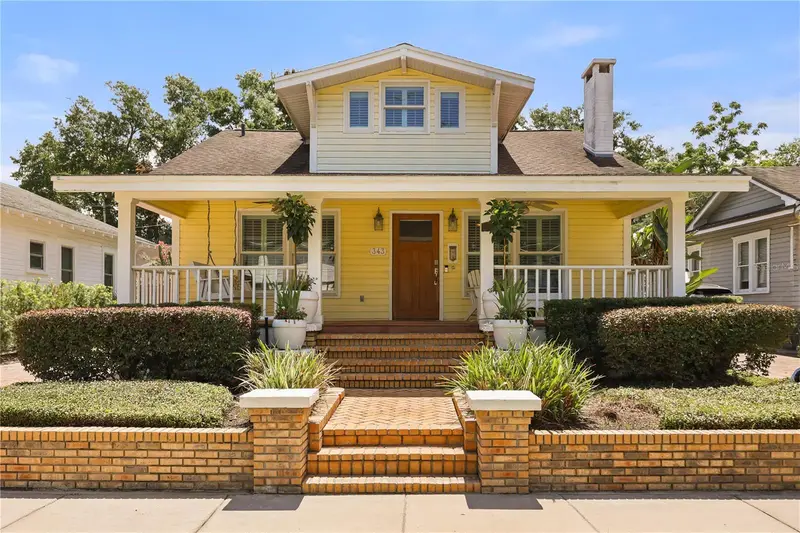
Thornton Park is the neighborhood Orlando urbanists have been moving to since the 1990s, when a group of residents — many of them LGBTQ+ homeowners — bought and renovated Craftsman bungalows on brick streets for $50,000 to $150,000 and quietly turned one of the city's most neglected addresses into its most walkable. The bones of the place are genuinely distinctive: 1911-to-1950s Craftsman and Colonial Revival homes, original brick-paved streets, Spanish-moss-draped oaks, and Lake Eola five to ten minutes on foot. The Washington Street independent dining scene — Eola Wine Company, RusTeak, Anthony's Thornton Park — isn't a lifestyle amenity layered on top of the neighborhood; it grew organically out of the community and stays because the demand is permanent. No HOA, which at this price tier is worth noting.
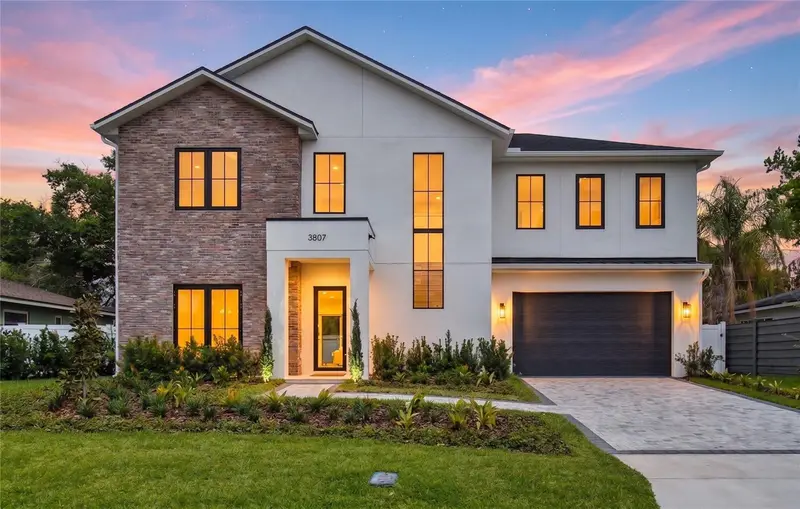
The Lake Eola Heights Historic District covers 487 contributing structures and carries both City of Orlando local historic designation and National Register of Historic Places listing — protections that effectively prevent teardown and enforce character in a way no deed restriction can. That supply constraint is the dominant market dynamic: the neighborhood doesn't expand, renovation premiums are real (a fully renovated bungalow runs 20 to 35 percent above its unrenovated peer on the same block), and owners typically hold seven to ten years or more. Buyers cross-shopping Thornton Park against SoDo should understand the price gap honestly — SoDo delivers the same downtown ZIP and the same hospital proximity for $100,000 to $200,000 less, but without the lake walk, the historic brick streets, or the polished scene on Washington Street. You're paying for the character, and the character is real.
— Ryan Solberg, Broker/Owner, MaxLife Realty
Under Contract
20 homes pending in Thornton Park / Milk District · Avg. $767K
Thornton Park / Milk District · 3rd Quarter 2026
379 sales · Stellar MLS · last 12 mo
$520K
Median Sale Price
28 days
Median Days on Market
97.1%
Sold-to-List
$341
Median $/sqft
Recent Sales Map
60 recent individual sales in and around Thornton Park / Milk District · FL public records · no addresses published
Approximate sale locations — dots are offset ±1 home for privacy
| Beds | Baths | Sq Ft | Listed | Sold ▼ | List Price | Sold Price | $/Sq Ft | DOM |
|---|---|---|---|---|---|---|---|---|
| — | — | 5,903 | — | 12/1/25 | — | $6,000,000 | $1,016 | — |
| — | — | 3,989 | — | 12/1/25 | — | $3,500,000 | $877 | — |
| — | — | 2,907 | — | 12/1/25 | — | $1,750,000 | $602 | — |
| — | — | 2,434 | — | 12/1/25 | — | $1,045,000 | $429 | — |
| — | — | 2,983 | — | 12/1/25 | — | $810,000 | $272 | — |
| — | — | 2,505 | — | 12/1/25 | — | $750,000 | $299 | — |
| — | — | 2,497 | — | 12/1/25 | — | $700,000 | $280 | — |
| — | — | 1,974 | — | 12/1/25 | — | $655,000 | $332 | — |
| — | — | 1,864 | — | 12/1/25 | — | $650,000 | $349 | — |
| — | — | 1,448 | — | 12/1/25 | — | $625,000 | $432 | — |
| — | — | 1,517 | — | 12/1/25 | — | $595,000 | $392 | — |
| — | — | 1,724 | — | 12/1/25 | — | $544,000 | $316 | — |
| — | — | 1,693 | — | 12/1/25 | — | $493,000 | $291 | — |
| — | — | 1,139 | — | 12/1/25 | — | $480,000 | $421 | — |
| — | — | 1,800 | — | 12/1/25 | — | $466,800 | $259 | — |
| — | — | 1,799 | — | 12/1/25 | — | $465,000 | $258 | — |
| — | — | 1,010 | — | 12/1/25 | — | $455,000 | $450 | — |
| — | — | 1,416 | — | 12/1/25 | — | $440,000 | $311 | — |
| — | — | 1,325 | — | 12/1/25 | — | $420,000 | $317 | — |
| — | — | 1,341 | — | 12/1/25 | — | $400,000 | $298 | — |
| — | — | 1,647 | — | 12/1/25 | — | $390,000 | $237 | — |
| — | — | 1,351 | — | 12/1/25 | — | $375,000 | $278 | — |
| — | — | 1,441 | — | 12/1/25 | — | $365,000 | $253 | — |
| — | — | 958 | — | 12/1/25 | — | $360,000 | $376 | — |
| — | — | 1,377 | — | 12/1/25 | — | $360,000 | $261 | — |
| — | — | 896 | — | 12/1/25 | — | $345,000 | $385 | — |
| — | — | 1,300 | — | 12/1/25 | — | $313,000 | $241 | — |
| — | — | 1,148 | — | 12/1/25 | — | $310,000 | $270 | — |
| — | — | 4,696 | — | 11/1/25 | — | $2,195,000 | $467 | — |
| — | — | 2,540 | — | 11/1/25 | — | $1,230,000 | $484 | — |
| — | — | 2,772 | — | 11/1/25 | — | $1,200,000 | $433 | — |
| — | — | 3,424 | — | 11/1/25 | — | $840,000 | $245 | — |
| — | — | 2,388 | — | 11/1/25 | — | $699,900 | $293 | — |
| — | — | 1,276 | — | 11/1/25 | — | $675,000 | $529 | — |
| — | — | 2,069 | — | 11/1/25 | — | $658,000 | $318 | — |
| — | — | 2,040 | — | 11/1/25 | — | $579,000 | $284 | — |
| — | — | 1,931 | — | 11/1/25 | — | $575,000 | $298 | — |
| — | — | 2,107 | — | 11/1/25 | — | $525,000 | $249 | — |
| — | — | 1,678 | — | 11/1/25 | — | $505,000 | $301 | — |
| — | — | 1,293 | — | 11/1/25 | — | $500,000 | $387 | — |
| — | — | 1,272 | — | 11/1/25 | — | $465,000 | $366 | — |
| — | — | 1,263 | — | 11/1/25 | — | $450,000 | $356 | — |
| — | — | 1,096 | — | 11/1/25 | — | $450,000 | $411 | — |
| — | — | 855 | — | 11/1/25 | — | $450,000 | $526 | — |
| — | — | 1,018 | — | 11/1/25 | — | $440,000 | $432 | — |
| — | — | 972 | — | 11/1/25 | — | $420,000 | $432 | — |
| — | — | 972 | — | 11/1/25 | — | $417,000 | $429 | — |
| — | — | 1,160 | — | 11/1/25 | — | $399,900 | $345 | — |
| — | — | 816 | — | 11/1/25 | — | $395,000 | $484 | — |
| — | — | 1,300 | — | 11/1/25 | — | $324,000 | $249 | — |
| — | — | 732 | — | 11/1/25 | — | $314,900 | $430 | — |
| — | — | 1,686 | — | 11/1/25 | — | $295,000 | $175 | — |
| — | — | 1,471 | — | 11/1/25 | — | $295,000 | $201 | — |
| — | — | 2,633 | — | 10/1/25 | — | $1,875,000 | $712 | — |
| — | — | 2,960 | — | 10/1/25 | — | $1,325,000 | $448 | — |
| — | — | 1,569 | — | 10/1/25 | — | $704,000 | $449 | — |
| — | — | 1,560 | — | 10/1/25 | — | $695,000 | $446 | — |
| — | — | 1,382 | — | 10/1/25 | — | $640,000 | $463 | — |
| — | — | 1,490 | — | 10/1/25 | — | $640,000 | $430 | — |
| — | — | 1,757 | — | 10/1/25 | — | $639,000 | $364 | — |
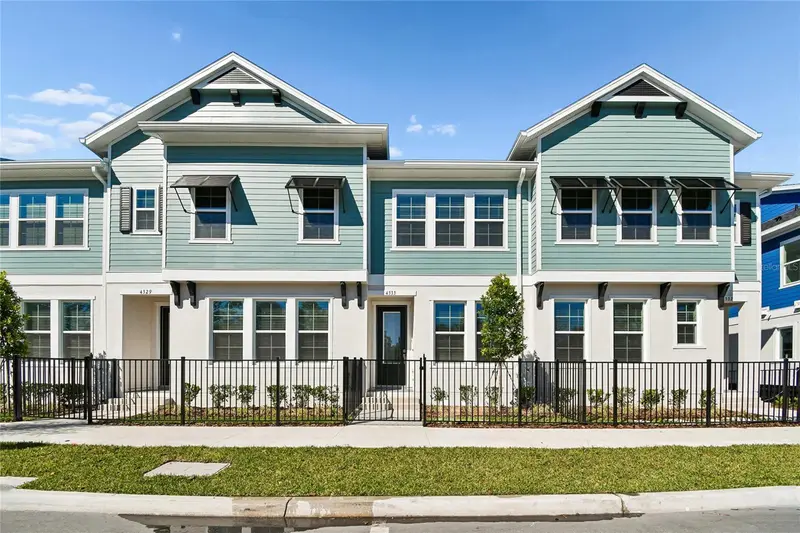
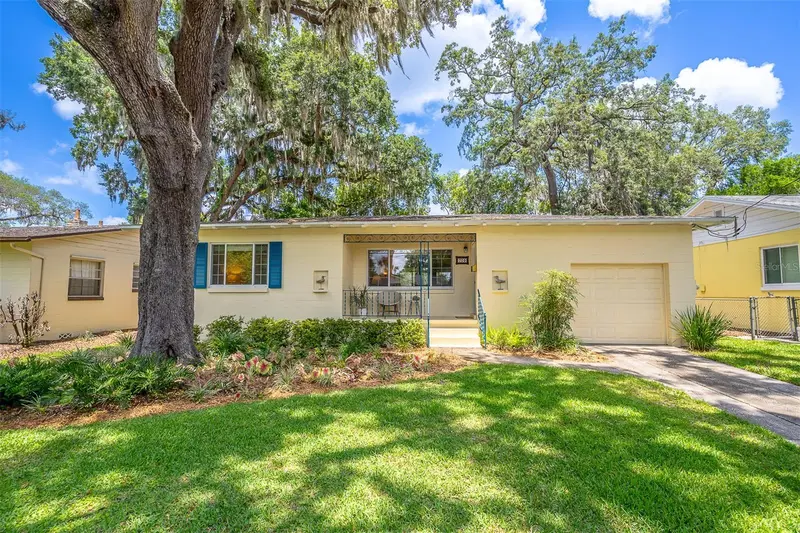
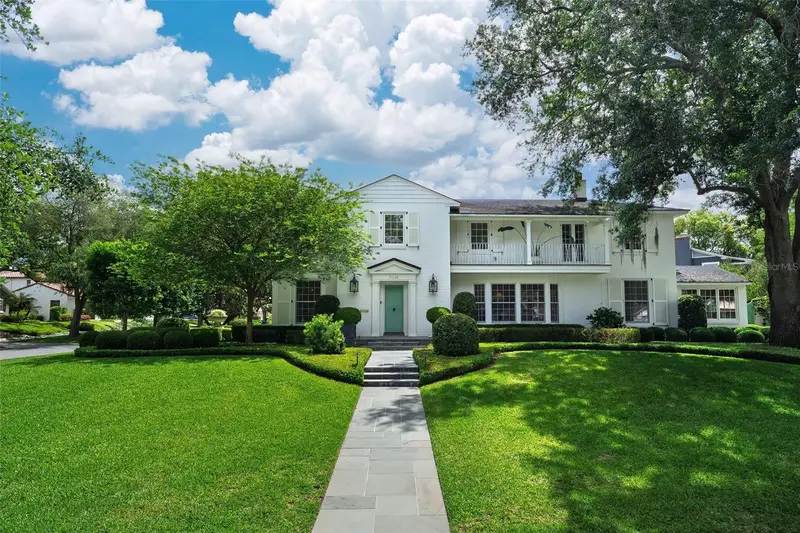
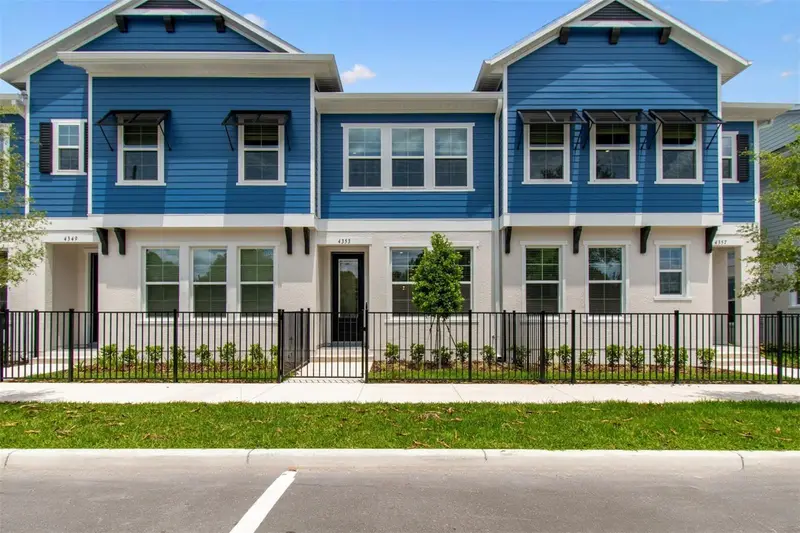
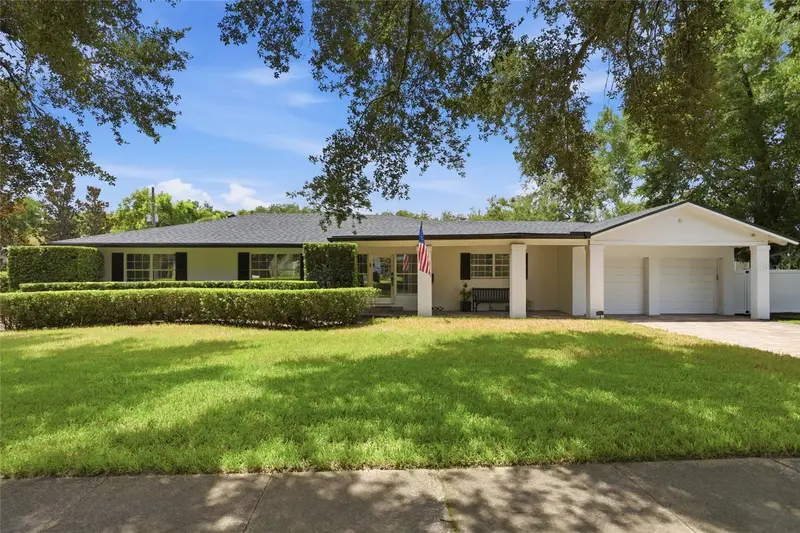
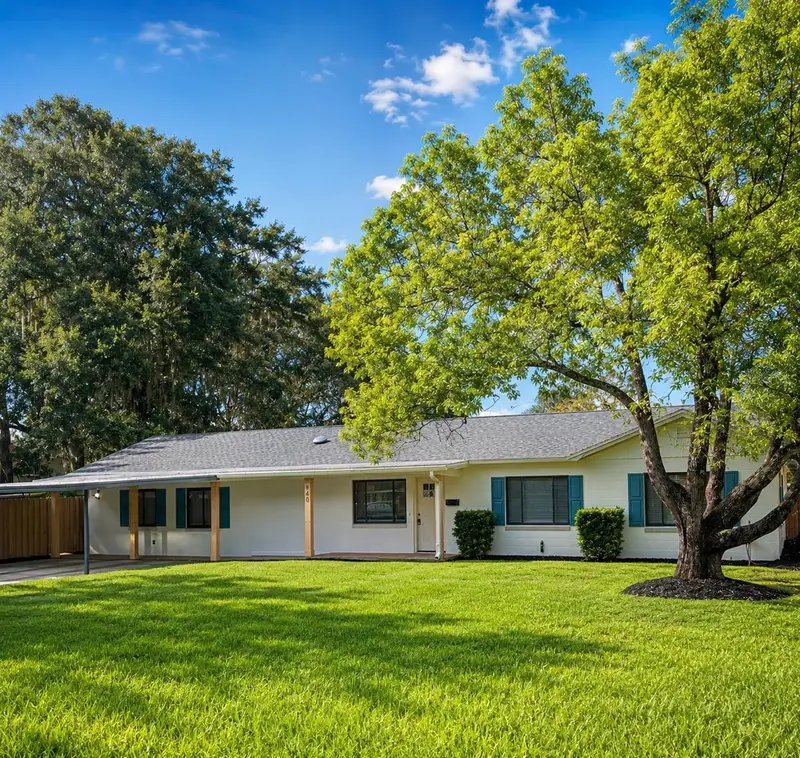
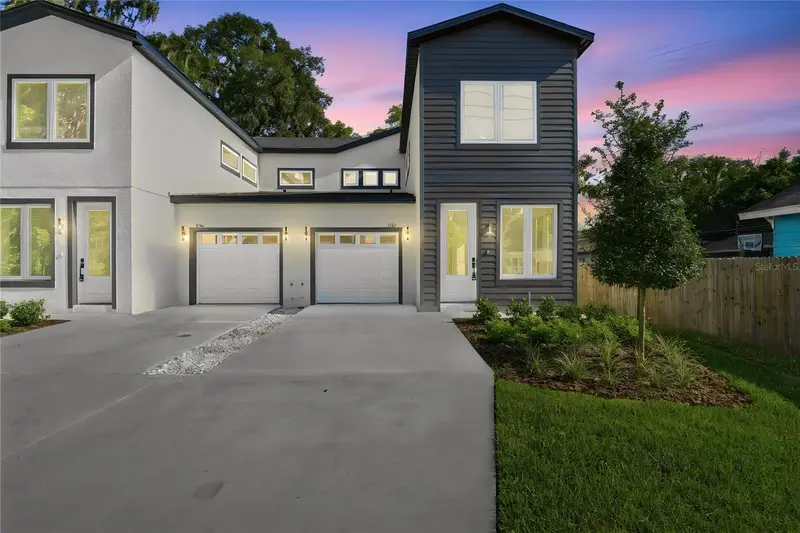
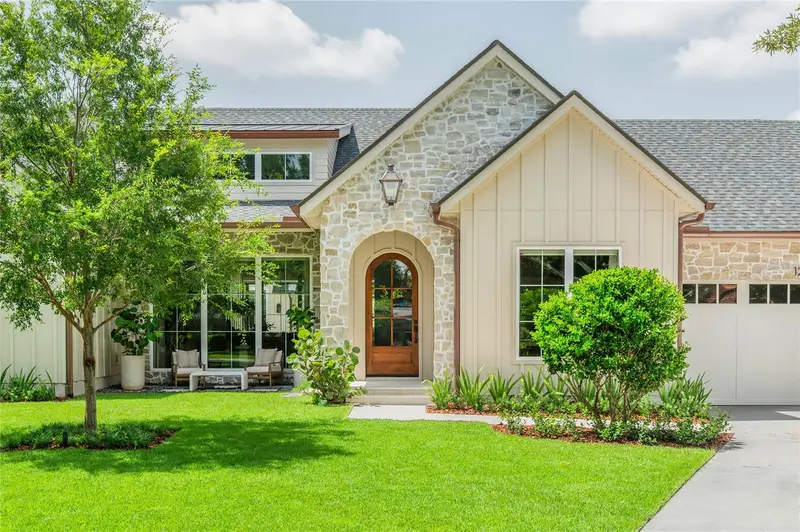
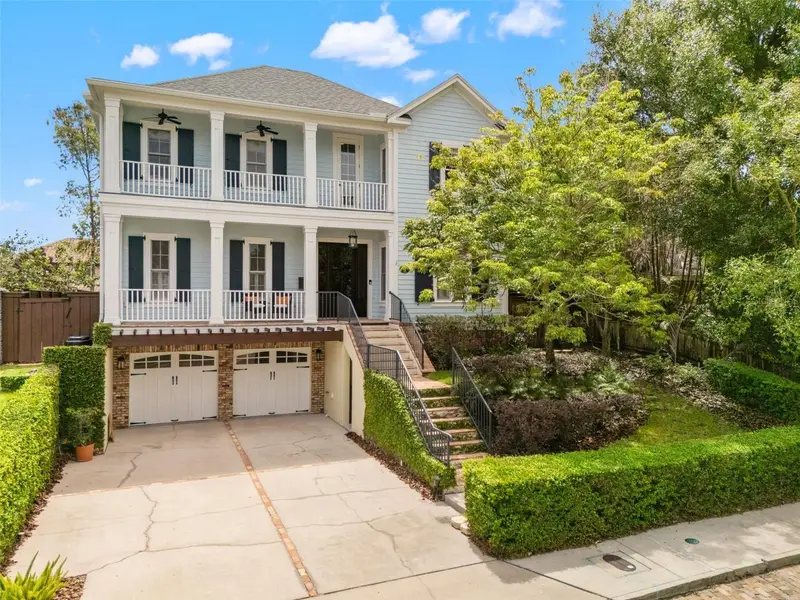
Currently For Sale
50 active listings in Thornton Park / Milk District
$354/sqft
View details
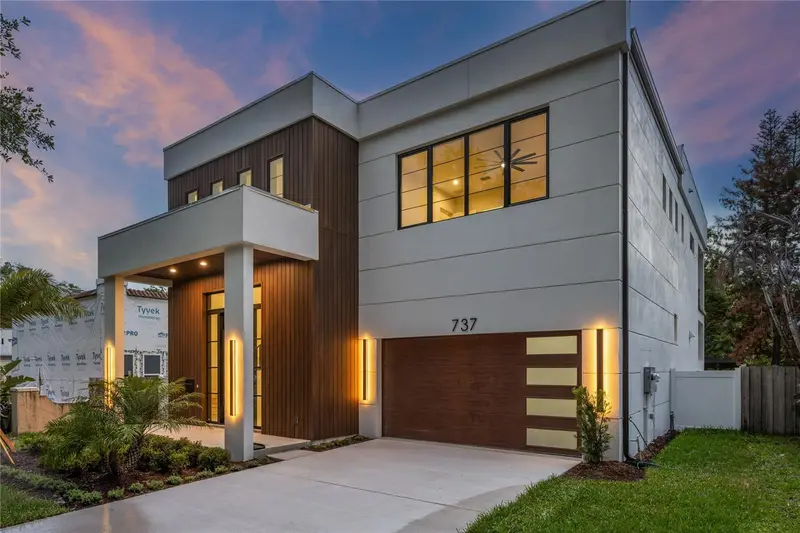
$355/sqft
View details
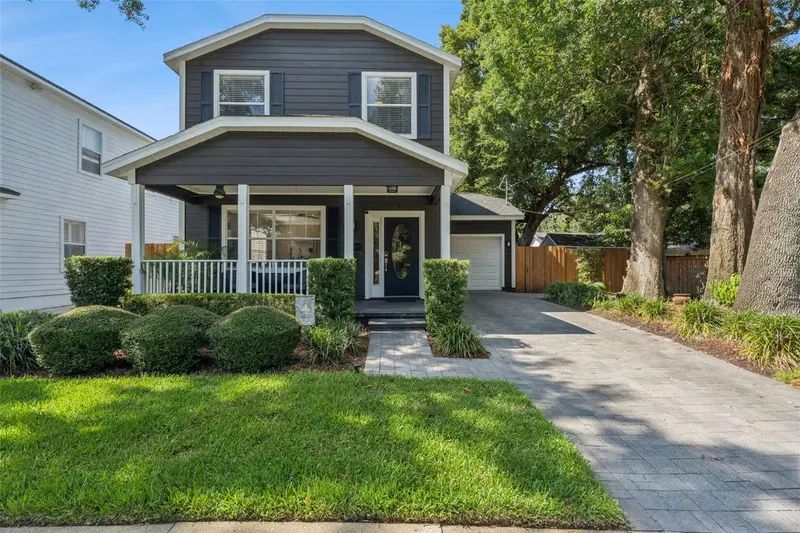
$547/sqft
View details
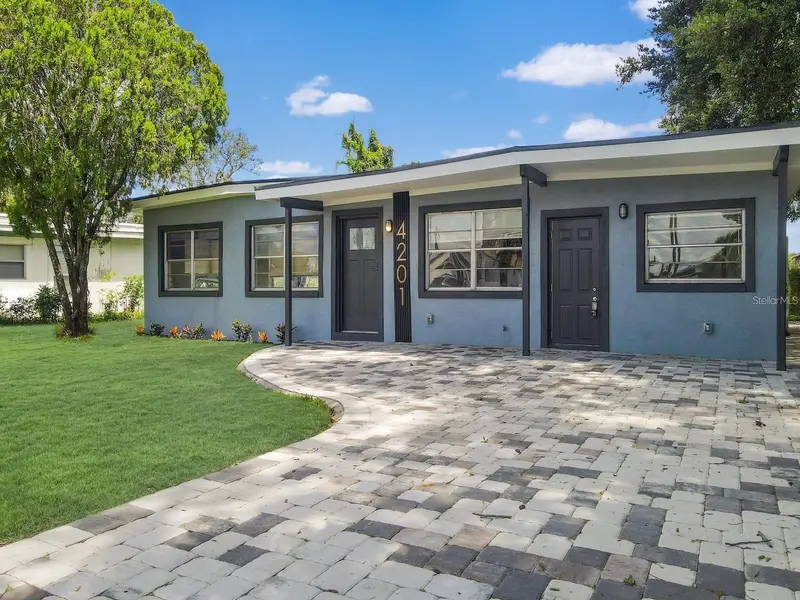
$336/sqft
View details
$355/sqft
View details
$812/sqft
View details
$481/sqft
View details
$505/sqft
View details
$357/sqft
View details
$244/sqft
View details
$395/sqft
View details
$446/sqft
View details
| Beds | Baths | Sq Ft | List Price | $/Sq Ft | DOM | Pool | Waterfront | View |
|---|---|---|---|---|---|---|---|---|
| 4 | 4 | 3,329 | $1,180,000 | $354 | 3 | — | ✓ | Lake Gear |
| 3 | 3 | 1,576 | $559,000 | $355 | 2 | — | — | — |
| 3 | 2 | 2,366 | $1,295,000 | $547 | 2 | ✓ | — | — |
| 4 | 4 | 2,277 | $765,000 | $336 | 23 | ✓ | — | — |
| 3 | 3 | 1,576 | $559,000 | $355 | 2 | — | — | — |
| 5 | 6 | 3,689 | $2,995,000 | $812 | 2 | ✓ | — | — |
| 5 | 5 | 4,521 | $2,175,000 | $481 | 42 | ✓ | — | — |
| 3 | 4 | 3,266 | $1,650,000 | $505 | 53 | ✓ | — | — |
| 3 | 3 | 1,892 | $674,900 | $357 | 18 | — | — | — |
| 3 | 2 | 1,601 | $390,000 | $244 | 85 | — | — | — |
| 3 | 3 | 1,835 | $725,000 | $395 | 77 | — | — | — |
| 5 | 5 | 3,358 | $1,499,000 | $446 | 66 | ✓ | — | — |
| 5 | 6 | 3,452 | $1,700,000 | $492 | 29 | ✓ | — | — |
| 3 | 3 | 1,878 | $499,650 | $266 | 17 | — | — | — |
| 3 | 2 | 1,028 | $595,000 | $579 | 2 | — | — | — |
| 3 | 3 | 2,116 | $525,000 | $248 | 221 | ✓ | — | — |
| 4 | 2 | 1,926 | $526,000 | $273 | 16 | — | — | — |
| 2 | 2 | 1,786 | $545,000 | $305 | 138 | — | — | — |
| 3 | 4 | 2,181 | $634,900 | $291 | 38 | — | — | — |
| 4 | 2 | 1,348 | $450,000 | $334 | 24 | — | — | — |
| 5 | 5 | 3,337 | $1,424,900 | $427 | 65 | ✓ | — | — |
| 5 | 4 | 2,895 | $1,582,000 | $546 | 21 | — | — | — |
| 3 | 3 | 2,349 | $998,500 | $425 | 74 | ✓ | — | — |
| 6 | 3 | 3,213 | $1,100,000 | $342 | 3 | — | — | — |
| 3 | 3 | 2,586 | $950,000 | $367 | 3 | — | — | — |
| 4 | 3 | 2,166 | $888,000 | $410 | 6 | — | — | — |
| 5 | 3 | 2,080 | $449,900 | $216 | 65 | — | — | — |
| 3 | 2 | 1,150 | $425,000 | $370 | 23 | — | — | — |
| 5 | 5 | 3,497 | $1,639,000 | $469 | 26 | ✓ | — | — |
| 3 | 2 | 1,752 | $649,000 | $370 | 35 | ✓ | — | — |
| 4 | 3 | 2,249 | $997,000 | $443 | 8 | — | — | — |
| 6 | 5 | 2,710 | $799,000 | $295 | 5 | — | — | — |
| 2 | 1 | 880 | $397,000 | $451 | 52 | — | — | — |
| 5 | 5 | 3,230 | $1,099,999 | $341 | 451 | — | — | — |
| 3 | 2 | 1,483 | $517,500 | $349 | 86 | — | — | — |
| 3 | 2 | 1,238 | $450,000 | $363 | 25 | — | — | — |
| 3 | 2 | 1,288 | $450,000 | $349 | 33 | — | — | — |
| 4 | 3 | 2,044 | $699,990 | $342 | 33 | — | — | — |
| 4 | 3 | 2,044 | $699,990 | $342 | 33 | — | — | — |
| 3 | 4 | 2,097 | $625,000 | $298 | 47 | — | — | — |
| 3 | 3 | 2,001 | $549,900 | $275 | 65 | — | — | — |
| 1 | 2 | 1,988 | $469,900 | $236 | 19 | — | — | — |
| 3 | 3 | 2,446 | $729,900 | $298 | 18 | — | — | — |
| — | 0 | — | $2,525,000 | — | 19 | — | — | Water |
| 4 | 4 | 4,094 | $2,525,000 | $617 | 19 | — | ✓ | Lake Sue |
| 4 | 3 | 2,378 | $720,000 | $303 | 79 | — | — | — |
| 3 | 4 | 1,880 | $615,000 | $327 | 8 | — | — | — |
| 4 | 2 | 1,594 | $579,900 | $364 | 38 | — | — | — |
| 2 | 2 | 1,189 | $375,000 | $315 | 51 | — | — | — |
| 3 | 2 | 2,276 | $850,000 | $373 | 59 | — | — | — |
Thornton Park / Milk District Market — Common Questions
Is Thornton Park / Milk District a buyer's or seller's market in 2026?+
Thornton Park / Milk District is currently a seller's market with about 3.1 months of inventory. About 3.1 months of inventory — homes are selling faster than new ones come on the market, so sellers hold the leverage (under 4 months = seller's market).
What is the median home sale price in Thornton Park / Milk District?+
Based on Florida Department of Revenue public records over the last 6 months, the median sale price in Thornton Park / Milk District is approximately $520K, down about 13.2% from a year earlier.
How many homes are for sale in Thornton Park / Milk District?+
There are currently 98 active listings in Thornton Park / Milk District, with homes selling at roughly 31.6 per month. That works out to about 3.1 months of inventory.
Free · No Obligation
What Is Your Thornton Park / Milk District Home Worth?
I analyze active competition, recent sales, and neighborhood trends to give you a precise estimate of what your home is worth right now — no automated Zestimate, a real analysis from a local expert.

Ryan Solberg
MaxLife Realty
321.373.3536
Report generated July 17, 2026 at 8:17 PM ET· Powered by Stellar MLS
MLS Data:Active and pending listing data is sourced from the Stellar MLS as distributed by MLS GRID. Listings courtesy of Stellar MLS as distributed by MLS GRID. IDX information is provided exclusively for consumers' personal, non-commercial use and may not be used for any purpose other than to identify prospective properties consumers may be interested in purchasing. The MLS GRID does not guarantee the accuracy of this data, which may not reflect all real estate activity in the area.
Sold Data: Sales analysis is derived from Florida Department of Revenue public property records(arm's-length transactions). Ryan Solberg and MaxLife Realty LLC are not affiliated with Thornton Park / Milk Districtor its HOA. This report is not intended to solicit properties already listed for sale nor to cause a breach of an existing agency relationship. Data should be independently verified. E&OE.
Based on information submitted to the MLS GRID as of July 17, 2026 at 7:10 PM ET. All data is obtained from various sources and may not have been verified by broker or MLS GRID. Supplied Open House Information is subject to change without notice. All information should be independently reviewed and verified for accuracy. Properties may or may not be listed by the office/agent presenting the information.
Listings courtesy of Stellar MLS as distributed by MLS GRID
IDX information is provided exclusively for consumers’ personal, non-commercial use and may not be used for any purpose other than to identify prospective properties consumers may be interested in purchasing.
Based on information submitted to the MLS GRID as of July 17, 2026 at 7:10 PM ET. All data is obtained from various sources and may not have been verified by broker or MLS GRID. Supplied Open House Information is subject to change without notice. All information should be independently reviewed and verified for accuracy. Properties may or may not be listed by the office/agent presenting the information.
All or a portion of the multiple listing information is provided by Stellar MLS, from a copyrighted compilation of listings. The compilation of listings and each individual listing are © 2026 Stellar MLS. All rights reserved.
Ryan Solberg, Broker · MaxLife Realty LLC · FL License #BK3354351 · Equal Housing Opportunity · Full disclaimer · DMCA