MLS data updated Jul 16, 2026
Orange City
Blue Spring area community with SunRail service to Orlando
Orange City, FL
Orange City sits next to Blue Spring State Park in west-central Volusia County and offers affordable suburban housing with SunRail access, drawing families and commuters from the greater Orlando market.
Median sold: $304K · Median days on market: 34 · Sold-to-list: 98.0% · Source: Stellar MLS
About 4.1 months of inventory — supply and demand are roughly even, so neither side has a clear edge (4–6 months = balanced).
Aggregate statistics from recent Stellar MLS closed sales and live MLS inventory. A market read, not an appraisal of any home or a listing of individual sales.
Want this as a printable report?
Generate a clean, branded multi-page PDF of the Orange City market — perfect to print or email.
Ryan's Take on Orange City
Orange City is the DeLand alternative that most buyers don't consider until they've had sticker shock at Stetson-adjacent pricing. The two towns are ten minutes apart on US-17, share essentially the same commute story — Daytona in thirty minutes, downtown Orlando in forty-five off-peak — and both have genuine small-town character with historic downtown bones. The difference is that Orange City's revitalization is still building momentum, which means the buyers I work with here are often getting ground-floor pricing on a story that DeLand already told five years ago. Victorian and Craftsman homes that run $600K to $900K on Woodland Boulevard in DeLand are $300K to $500K in Orange City with the same vintage and bones.
The St. Johns River is the asset that most people underestimate. Public boat ramps and kayak launches at downtown parks give residents direct access to one of Florida's most significant river systems without the private waterfront premium — and the connected lake chain extends that recreation radius considerably. University High School in Orange City serves this area. The buyer coming here is typically a historic-home enthusiast or a small-town family who got priced out of DeLand, a remote worker building a life around outdoor recreation rather than office proximity, or an investor patient enough to hold through the revitalization arc. The cross-shop is Deltona if pure price is the variable, or DeLand if the completed downtown scene and Stetson cultural programming are the priority.
— Ryan Solberg, Broker/Owner, MaxLife Realty
Under Contract
18 homes pending in Orange City · Avg. $412K
Orange City · 3rd Quarter 2026
290 sales · Stellar MLS · last 12 mo
$304K
Median Sale Price
34 days
Median Days on Market
98.0%
Sold-to-List
$211
Median $/sqft
Recent Sales Map
60 recent individual sales in and around Orange City · FL public records · no addresses published
Approximate sale locations — dots are offset ±1 home for privacy
| Beds | Baths | Sq Ft | Listed | Sold ▼ | List Price | Sold Price | $/Sq Ft | DOM |
|---|---|---|---|---|---|---|---|---|
| — | — | 1,632 | — | 12/1/25 | — | $340,000 | $208 | — |
| — | — | 1,990 | — | 12/1/25 | — | $340,000 | $171 | — |
| — | — | 1,709 | — | 12/1/25 | — | $337,000 | $197 | — |
| — | — | 1,774 | — | 12/1/25 | — | $320,000 | $180 | — |
| — | — | 1,495 | — | 12/1/25 | — | $301,500 | $202 | — |
| — | — | 1,956 | — | 12/1/25 | — | $285,000 | $146 | — |
| — | — | 1,100 | — | 12/1/25 | — | $279,900 | $254 | — |
| — | — | 1,787 | — | 12/1/25 | — | $275,000 | $154 | — |
| — | — | 1,080 | — | 12/1/25 | — | $267,000 | $247 | — |
| — | — | 856 | — | 12/1/25 | — | $253,500 | $296 | — |
| — | — | 1,050 | — | 12/1/25 | — | $250,000 | $238 | — |
| — | — | 1,362 | — | 12/1/25 | — | $242,000 | $178 | — |
| — | — | 1,115 | — | 12/1/25 | — | $205,000 | $184 | — |
| — | — | 1,633 | — | 12/1/25 | — | $200,000 | $122 | — |
| — | — | 2,552 | — | 11/1/25 | — | $411,000 | $161 | — |
| — | — | 1,980 | — | 11/1/25 | — | $389,000 | $196 | — |
| — | — | 2,175 | — | 11/1/25 | — | $380,000 | $175 | — |
| — | — | 2,000 | — | 11/1/25 | — | $325,000 | $163 | — |
| — | — | 1,346 | — | 11/1/25 | — | $300,000 | $223 | — |
| — | — | 1,693 | — | 11/1/25 | — | $300,000 | $177 | — |
| — | — | 1,214 | — | 11/1/25 | — | $295,000 | $243 | — |
| — | — | 1,372 | — | 11/1/25 | — | $275,000 | $200 | — |
| — | — | 1,571 | — | 11/1/25 | — | $270,000 | $172 | — |
| — | — | 2,598 | — | 11/1/25 | — | $270,000 | $104 | — |
| — | — | 1,353 | — | 11/1/25 | — | $270,000 | $200 | — |
| — | — | 1,170 | — | 11/1/25 | — | $260,000 | $222 | — |
| — | — | 1,168 | — | 11/1/25 | — | $244,100 | $209 | — |
| — | — | 1,187 | — | 11/1/25 | — | $230,000 | $194 | — |
| — | — | 1,438 | — | 11/1/25 | — | $225,000 | $156 | — |
| — | — | 1,211 | — | 11/1/25 | — | $220,000 | $182 | — |
| — | — | 1,049 | — | 11/1/25 | — | $218,000 | $208 | — |
| — | — | 2,164 | — | 11/1/25 | — | $215,000 | $99 | — |
| — | — | 1,681 | — | 11/1/25 | — | $180,000 | $107 | — |
| — | — | 1,690 | — | 10/1/25 | — | $490,000 | $290 | — |
| — | — | 2,138 | — | 10/1/25 | — | $375,000 | $175 | — |
| — | — | 1,914 | — | 10/1/25 | — | $353,000 | $184 | — |
| — | — | 1,612 | — | 10/1/25 | — | $350,000 | $217 | — |
| — | — | 1,620 | — | 10/1/25 | — | $343,500 | $212 | — |
| — | — | 1,494 | — | 10/1/25 | — | $302,000 | $202 | — |
| — | — | 1,302 | — | 10/1/25 | — | $300,000 | $230 | — |
| — | — | 1,192 | — | 10/1/25 | — | $295,000 | $247 | — |
| — | — | 1,288 | — | 10/1/25 | — | $285,000 | $221 | — |
| — | — | 1,184 | — | 10/1/25 | — | $275,000 | $232 | — |
| — | — | 1,407 | — | 10/1/25 | — | $265,000 | $188 | — |
| — | — | 1,248 | — | 10/1/25 | — | $265,000 | $212 | — |
| — | — | 1,158 | — | 10/1/25 | — | $255,000 | $220 | — |
| — | — | 1,275 | — | 10/1/25 | — | $250,000 | $196 | — |
| — | — | 1,082 | — | 10/1/25 | — | $210,000 | $194 | — |
| — | — | 768 | — | 10/1/25 | — | $202,000 | $263 | — |
| — | — | 1,092 | — | 10/1/25 | — | $200,000 | $183 | — |
| — | — | 1,798 | — | 9/1/25 | — | $535,000 | $298 | — |
| — | — | 1,895 | — | 9/1/25 | — | $434,000 | $229 | — |
| — | — | 1,959 | — | 9/1/25 | — | $398,500 | $203 | — |
| — | — | 1,882 | — | 9/1/25 | — | $325,000 | $173 | — |
| — | — | 1,605 | — | 9/1/25 | — | $300,000 | $187 | — |
| — | — | 1,426 | — | 9/1/25 | — | $299,000 | $210 | — |
| — | — | 1,058 | — | 9/1/25 | — | $275,700 | $261 | — |
| — | — | 1,158 | — | 9/1/25 | — | $265,000 | $229 | — |
| — | — | 1,000 | — | 9/1/25 | — | $262,000 | $262 | — |
| — | — | 1,291 | — | 9/1/25 | — | $260,000 | $201 | — |
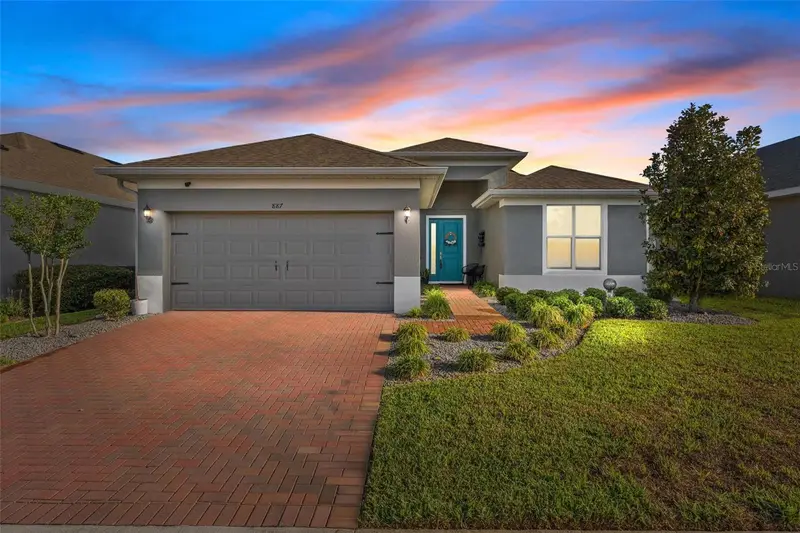
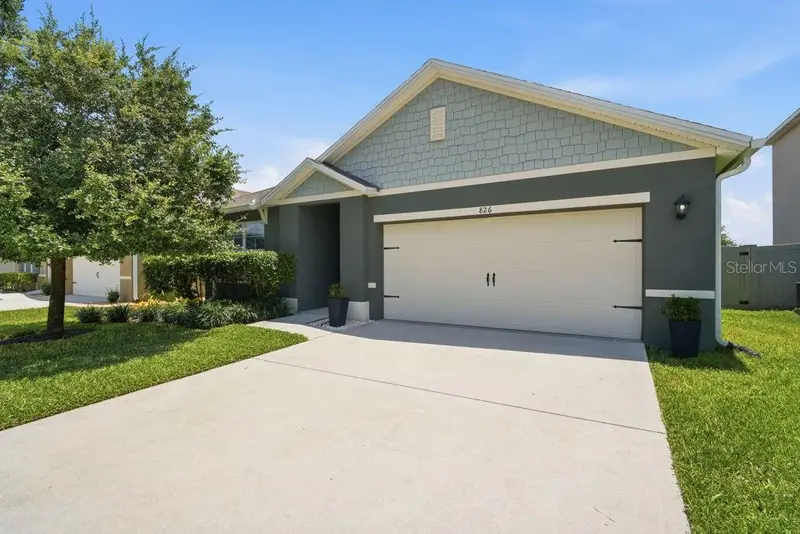
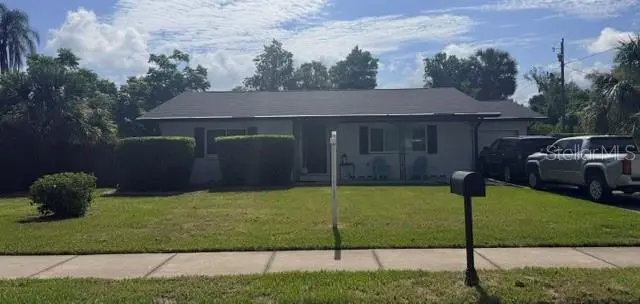
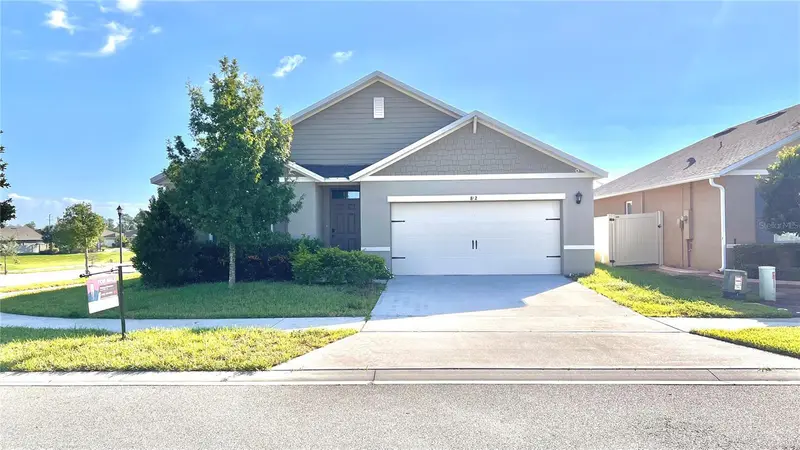
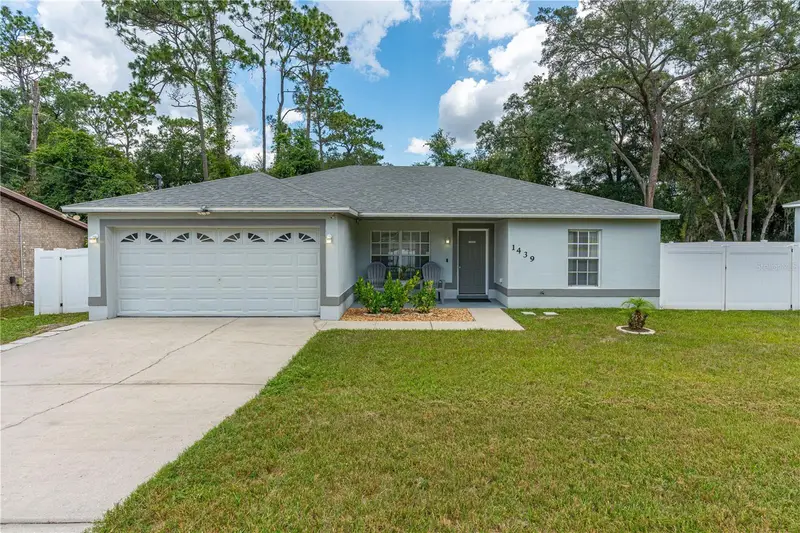
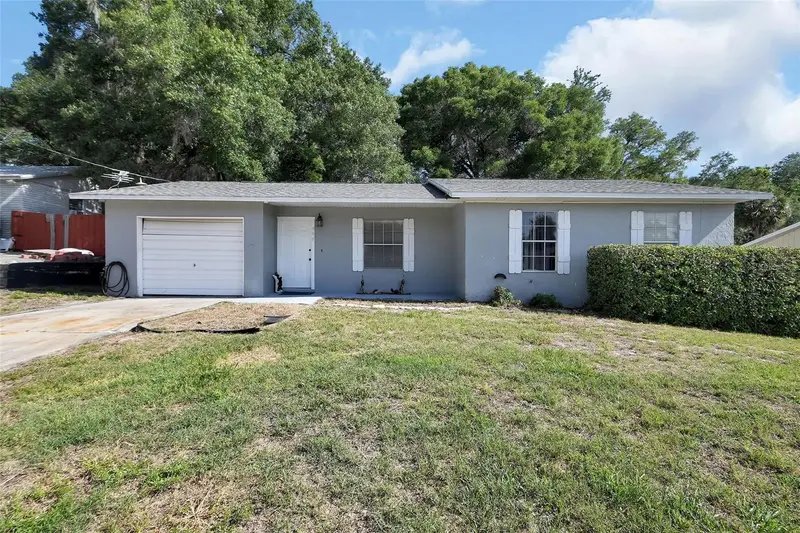
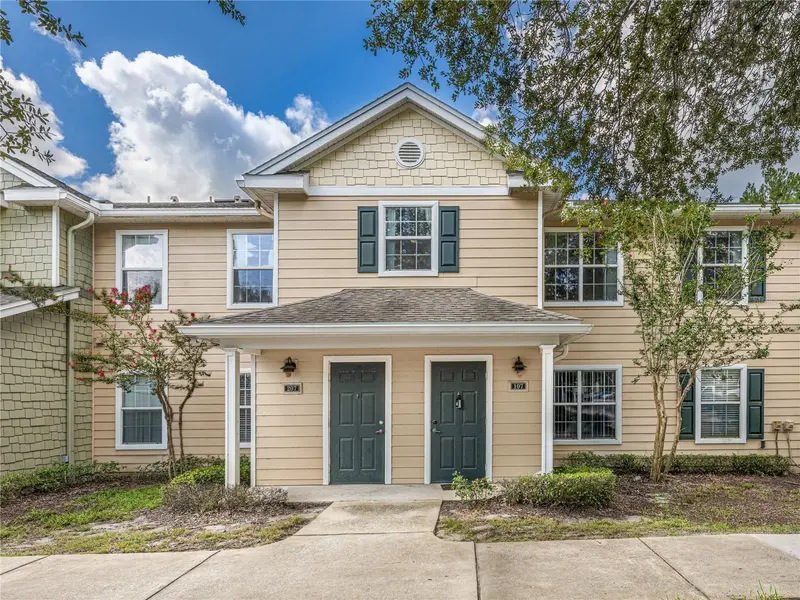
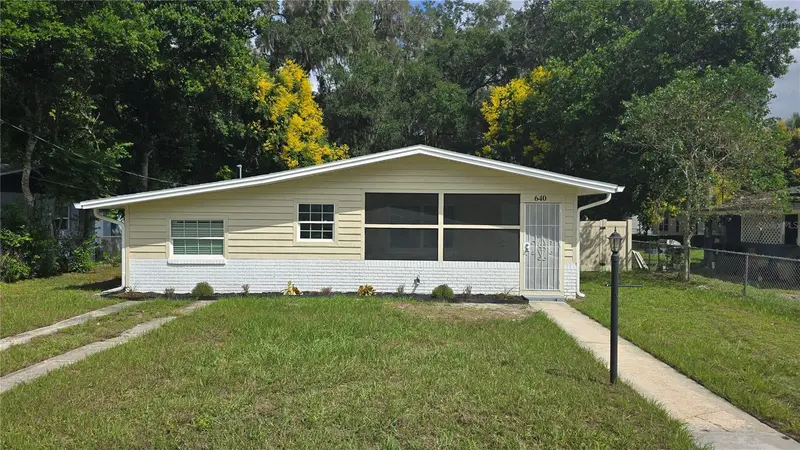
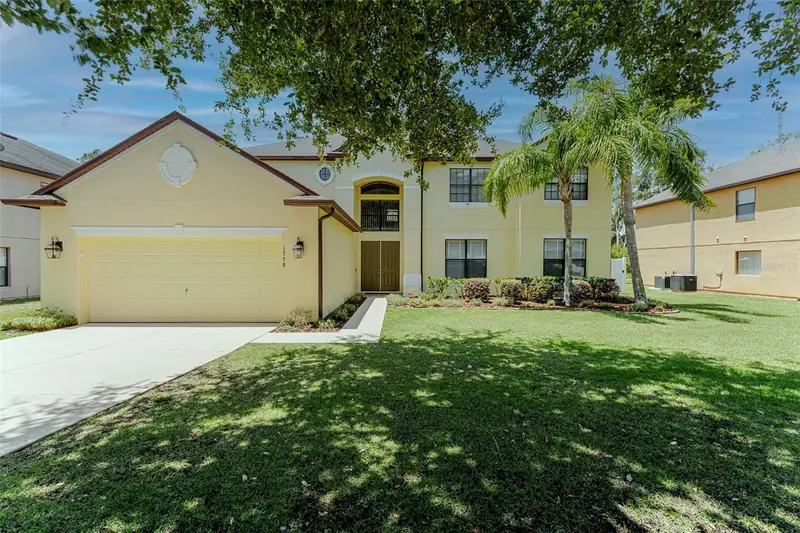
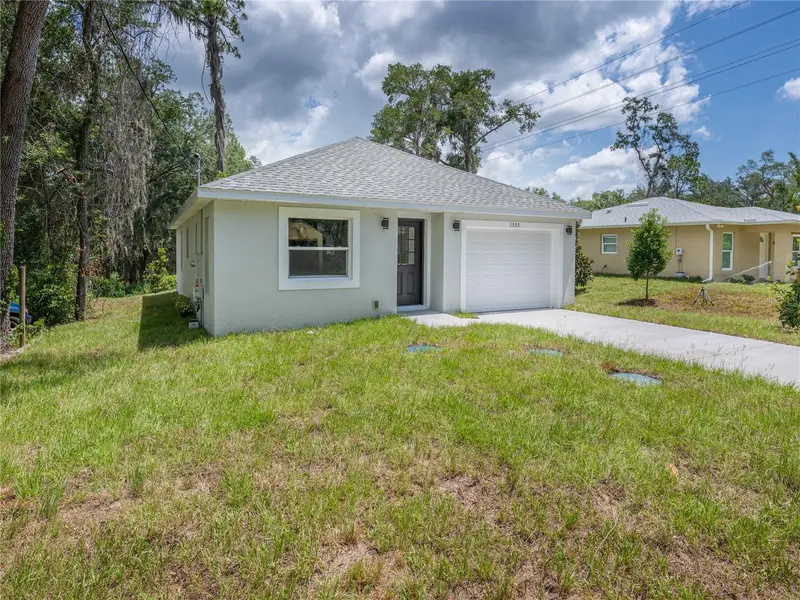
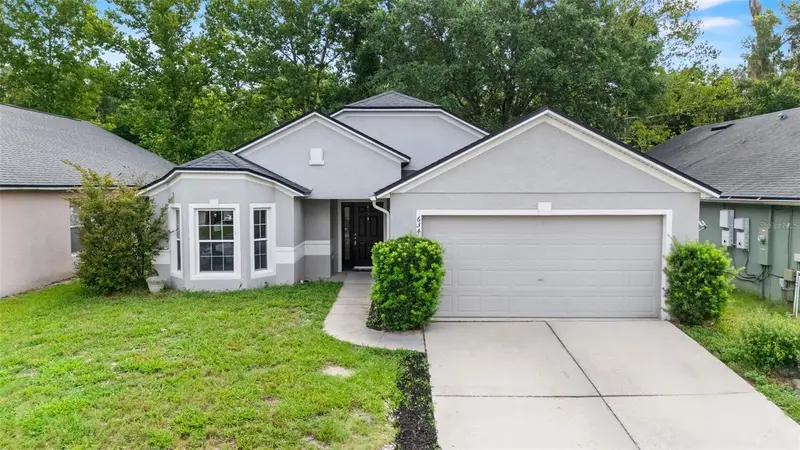
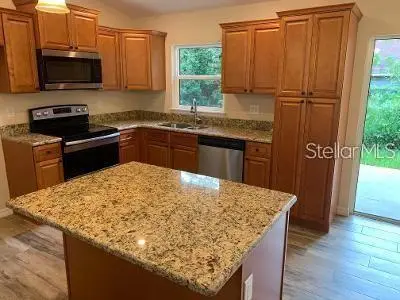
Currently For Sale
50 active listings in Orange City
$177/sqft
View details
$213/sqft
View details
$182/sqft
View details
$183/sqft
View details
$260/sqft
View details
$235/sqft
View details
$157/sqft
View details
$228/sqft
View details
$190/sqft
View details
$240/sqft
View details
$205/sqft
View details
$217/sqft
View details
| Beds | Baths | Sq Ft | List Price | $/Sq Ft | DOM | Pool | View |
|---|---|---|---|---|---|---|---|
| 3 | 2 | 1,046 | $185,000 | $177 | 10 | — | — |
| 3 | 1 | 1,198 | $254,900 | $213 | 23 | — | — |
| 4 | 1 | 1,458 | $265,000 | $182 | 185 | — | — |
| 4 | 2 | 1,787 | $327,900 | $183 | 79 | — | — |
| 3 | 2 | 1,286 | $334,900 | $260 | 19 | — | — |
| 4 | 2 | 1,619 | $380,000 | $235 | 18 | — | — |
| 6 | 4 | 4,286 | $675,000 | $157 | 178 | — | Water |
| 3 | 2 | 1,314 | $299,900 | $228 | 31 | — | — |
| 3 | 2 | 1,607 | $305,000 | $190 | 17 | — | — |
| 3 | 2 | 1,375 | $329,990 | $240 | 4 | — | — |
| 5 | 3 | 1,950 | $399,999 | $205 | 154 | — | — |
| 3 | 2 | 1,530 | $332,500 | $217 | 18 | — | — |
| 2 | 2 | 900 | $268,450 | $298 | 78 | — | — |
| 2 | 2 | 1,049 | $210,000 | $200 | 10 | — | — |
| 2 | 2 | 1,282 | $314,900 | $246 | 49 | — | — |
| 3 | 2 | 1,176 | $274,999 | $234 | 24 | — | — |
| 3 | 3 | 3,341 | $375,000 | $112 | 37 | ✓ | — |
| 4 | 3 | 2,567 | $494,900 | $193 | 72 | ✓ | — |
| 3 | 2 | 1,259 | $289,000 | $230 | 58 | — | — |
| 3 | 2 | 1,641 | $364,000 | $222 | 42 | — | — |
| 3 | 2 | 1,598 | $365,000 | $228 | 5 | — | — |
| 3 | 2 | 1,025 | $300,000 | $293 | 8 | — | — |
| 5 | 3 | 2,502 | $539,000 | $215 | 22 | — | — |
| 3 | 2 | 2,168 | $489,000 | $226 | 318 | — | — |
| 3 | 2 | 1,919 | $399,000 | $208 | 6 | ✓ | — |
| 3 | 2 | 1,983 | $390,000 | $197 | 51 | — | — |
| 3 | 2 | 1,205 | $289,000 | $240 | 18 | — | — |
| 3 | 2 | 1,184 | $179,900 | $152 | 157 | — | — |
| 4 | 3 | 2,000 | $349,900 | $175 | 161 | — | — |
| 2 | 2 | 644 | $235,000 | $365 | 47 | — | — |
| 3 | 2 | 1,695 | $314,000 | $185 | 289 | — | — |
| 3 | 2 | 1,612 | $315,500 | $196 | 122 | — | — |
| 3 | 2 | 1,790 | $369,900 | $207 | 9 | — | — |
| 3 | 2 | 1,166 | $299,900 | $257 | 43 | — | — |
| 3 | 2 | 1,988 | $370,000 | $186 | 25 | — | — |
| 3 | 2 | 1,252 | $239,900 | $192 | 73 | — | — |
| 4 | 3 | 2,379 | $520,000 | $219 | 549 | ✓ | — |
| 3 | 2 | 1,815 | $326,900 | $180 | 156 | — | — |
| 3 | 2 | 1,346 | $319,000 | $237 | 72 | — | — |
| 2 | 2 | 1,101 | $219,900 | $200 | 57 | — | — |
| 3 | 2 | 1,566 | $270,000 | $172 | 16 | — | — |
| 3 | 2 | 1,961 | $377,499 | $193 | 91 | — | — |
| 3 | 2 | 1,190 | $269,900 | $227 | 136 | ✓ | — |
| 3 | 2 | 1,584 | $324,900 | $205 | 34 | — | — |
| 3 | 2 | 1,320 | $275,000 | $208 | 273 | — | — |
| 3 | 3 | 1,624 | $395,000 | $243 | 16 | ✓ | — |
| 4 | 2 | 1,647 | $371,390 | $225 | 39 | — | — |
| 3 | 2 | 1,335 | $331,070 | $248 | 39 | — | — |
| 3 | 2 | 1,249 | $310,000 | $248 | 35 | — | — |
| 3 | 2 | 1,370 | $329,900 | $241 | 130 | ✓ | — |
Orange City Market — Common Questions
Is Orange City a buyer's or seller's market in 2026?+
Orange City is currently a balanced market with about 4.1 months of inventory. About 4.1 months of inventory — supply and demand are roughly even, so neither side has a clear edge (4–6 months = balanced).
What is the median home sale price in Orange City?+
Based on Florida Department of Revenue public records over the last 6 months, the median sale price in Orange City is approximately $304K, down about 4.8% from a year earlier.
How many homes are for sale in Orange City?+
There are currently 99 active listings in Orange City, with homes selling at roughly 24.2 per month. That works out to about 4.1 months of inventory.
Free · No Obligation
What Is Your Orange City Home Worth?
I analyze active competition, recent sales, and neighborhood trends to give you a precise estimate of what your home is worth right now — no automated Zestimate, a real analysis from a local expert.

Ryan Solberg
MaxLife Realty
321.373.3536
Report generated July 17, 2026 at 8:51 AM ET· Powered by Stellar MLS
MLS Data:Active and pending listing data is sourced from the Stellar MLS as distributed by MLS GRID. Listings courtesy of Stellar MLS as distributed by MLS GRID. IDX information is provided exclusively for consumers' personal, non-commercial use and may not be used for any purpose other than to identify prospective properties consumers may be interested in purchasing. The MLS GRID does not guarantee the accuracy of this data, which may not reflect all real estate activity in the area.
Sold Data: Sales analysis is derived from Florida Department of Revenue public property records(arm's-length transactions). Ryan Solberg and MaxLife Realty LLC are not affiliated with Orange Cityor its HOA. This report is not intended to solicit properties already listed for sale nor to cause a breach of an existing agency relationship. Data should be independently verified. E&OE.
Based on information submitted to the MLS GRID as of July 16, 2026 at 6:16 PM ET. All data is obtained from various sources and may not have been verified by broker or MLS GRID. Supplied Open House Information is subject to change without notice. All information should be independently reviewed and verified for accuracy. Properties may or may not be listed by the office/agent presenting the information.
Listings courtesy of Stellar MLS as distributed by MLS GRID
IDX information is provided exclusively for consumers’ personal, non-commercial use and may not be used for any purpose other than to identify prospective properties consumers may be interested in purchasing.
Based on information submitted to the MLS GRID as of July 16, 2026 at 6:16 PM ET. All data is obtained from various sources and may not have been verified by broker or MLS GRID. Supplied Open House Information is subject to change without notice. All information should be independently reviewed and verified for accuracy. Properties may or may not be listed by the office/agent presenting the information.
All or a portion of the multiple listing information is provided by Stellar MLS, from a copyrighted compilation of listings. The compilation of listings and each individual listing are © 2026 Stellar MLS. All rights reserved.
Ryan Solberg, Broker · MaxLife Realty LLC · FL License #BK3354351 · Equal Housing Opportunity · Full disclaimer · DMCA